STRIAN online structural analysis 2.0 by Miroslav Stibor and Petr Frantík
STRIPE 2.0 is a free online structural analysis tool designed for students and teachers. It is based on STRIAN software from 2015, criado por Miroslav Stibor e Petr Frantík, and uses the Matrix Stiffness Method, originally from MaFoDeM, other free structural analysis software.
Miroslav Stibor, Petr Frantík,
Wout Fierens for svg.js,
Joshua Gatcke for HTML KickStart,
Heat exchangers for hosting this domain,
Dave Furfero for jQuery UI Touch Punch,
Glyphter.com for vector icons.
Creating periods
Bars and beams begin and end at nodes, which are automatically generated. Hinges and brackets can only be placed within these nodes. When the bars cross, they don't interact.
You can drag a node to change its position (in the desktop version). Mouse pointer sticks to grid lines; grid spacing is based on zoom level. You can edit node coordinates in the Node Table later. Cross sections can later be assigned to bars and beams.
You can also press ESC to finish.
Creating supports and hinges
Brackets and hinges must be positioned at the nodes. Additional support types can be accessed and applied from the Node Table.
Truss solver
To use STRIAN as a truss solver, you must put hinges on the bars.

Inclined roller support
Tilted roller support is not implemented. Nonetheless, an alternative solution can be achieved by using an auxiliary rigid bar connected via a hinge.

Loads
Loads are generated pointing towards the beam. If they're not placed exactly where you want them, you can click on the load to adjust its position. Alternatively, you can open the Load Table to modify the loads. For continuous loads covering several sections, it will be necessary to repeat the load for each span.
Distributed load on inclined beams
The distributed load is specified per meter of beam (not by the projected length in the coordinate system). Example: if the beam is projected on the horizontal axis with 1 meter long, but its actual length is 1,41421 meters, the total force would be 1,41421 kN.

Load cases
To create and switch between load cases, use the drop-down box next to the last tab.
Sections
For simple beams, creating cross sections is unnecessary. Simple structures will be solved correctly without defining material and cross-sectional properties. Nonetheless, deflection data depends on these specifications. When you assign a cross section to a member, it will be displayed in the graphical view in parentheses next to the beam ID
For porches, It is crucial to assign appropriate sections to beams and bars to obtain accurate results. Beams generally have different stiffness compared to columns, and these differences significantly affect the results.
In structural analysis, it is typical not to consider the impact of shear when evaluating reactions or deflections, therefore the Gray (shear area) is optional. The shear area varies depending on the type of section, as solid section, I beam or hollow section. For clarification, consult other sources if you have questions.
After modifying a section, when saving, you will be asked to specify whether you want to create a new section or simply modify the current one.
Tables
Its structure can be described using nodes, beams, loads, sections and settlements. Each category is displayed in its respective table and you can edit the parameters directly from these tables. You cannot add a new row directly from a table.
Node table
Nodes are automatically generated when creating new beams. Incorrect coordinates can be corrected in this section. The first column displays the node ID, which is also marked graphically next to the nodes. The last column indicates the type of support in the node (if there is).
Beam table
The first column shows the beam ID, which is also marked graphically near the midpoint of the beams. The second column displays the section ID, indicated visually in parentheses after the beam ID. to follow, there are fields for the start node and the end node. Finally, smaller fields indicate the presence of a hinge.
Load table
Tables display node ID and beam ID, the node ID being crucial, as it indicates the starting point of the beam. The distances where loads are applied are measured on the beam from its starting point.
Load cases
This is an advanced feature used by few. It is possible to define multiple load cases in the same structure. For example, 1: own weight, 2: neve, 3: vento. When switching to another case, you will be working with a different set of loads. This allows you to analyze independent sets of loads and their respective results.
Section table
The created sections will be listed in this table and can be edited here. The first column is Section ID, which can be used to assign a section directly to(s) error(s) of the Beam Table.
Settlement table
Some problems may involve support settlement due to factors such as erosion or soil consolidation. Settlement can only be defined at supports.
The settlement table displays all nodes that have supports. If settlement is assigned to a node, it will be displayed here.
Files (load and save)
Your projects are saved on a server and cannot be stored on your local computer. When you first use STRIAN, the program receives a unique user ID from the server, which acts as your dedicated folder on the server. If you run STRIAN on another device (or even on the same device with a different account or browser), another folder will be created on the server. To share files between your devices, use the same user ID for one device on all of them.
Only the structure is saved; results and settings are not included in the file.
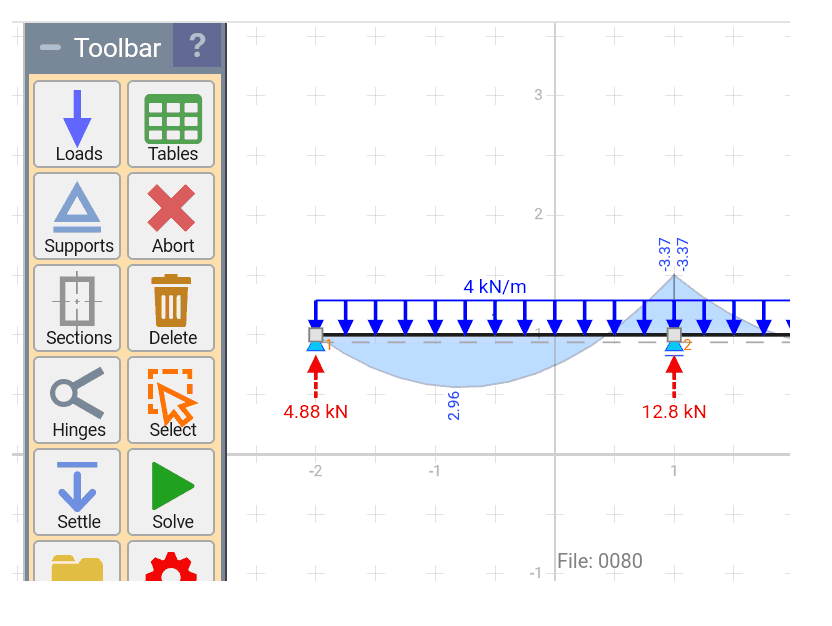
Results
If your model resolves successfully, results in supports and diagrams are available. The solver runs in your browser and is not dependent on the Internet. Initially, only reactions are displayed, but you can enable diagrams in the Settings dialog. If you need more detailed diagrams, create additional nodes within the specific area of interest.
settings
You control what and how is displayed. In some cases, graphical representations can cause entities to overlap.
Use '-' and '+' to zoom in and out of the structure.
The 'Zoom' feature in Settings is to improve the readability of descriptions and tags.
You can toggle object layers to temporarily hide them.
For optimal performance and greater ease of use, keep the paper size minimal for your structures.
STRIAN operates internally in SI units and coordinates are rounded to 1/100 millimeter precision. When switching to imperial units, you can enter measurements in feet and inches, like 2' 3", Which is equivalent to 2,25 inches.